Peer Review Article | Open Access | Published 4th January 2023
Use of Conductivity as a Tool for On-site Residue Management and Definition of Smart Cleanroom Regimes
Dr. Andreas Krause, Matthew Cokely, Laura Brennan & Aneta Schimanowitz - Ecolab Life Sciences, UK | EJPPS | 274 (2022) | https://doi.org/10.37521/ejpps.27401| Click to download pdf
Abstract
Surface residues that result from the use of cleaning and disinfection products are becoming an increasing focus of regulators in the Cleanroom industry. Driven largely by the update to EU GMP Annex 1 [1] and best practice recommendation from the PDA Journal of Pharmaceutical Science and Technology [2], it is now recognized that residues need to be managed to avoid any risks they could present to safety or product quality.
Residue management can be successfully achieved by selection and use of low residue disinfectants, through the frequency and choice of rinsing agent for removal, the use of the most suitable tools for physical removal like cleanroom specific mops, or a combination of all these factors.
Unlike product contact surfaces [3], there is no clear guidance as to what level of residue may be acceptable on small or large cleanroom surfaces, or how they can be quantified. For this reason, most people still rely on judging a surface to be ‘visibly clean’.
To improve detection and to quantify the level of residue on a cleanroom surface, a pragmatic method has been developed to measure residue anywhere on-site: Quantification of disinfectant residues by the use of conductivity.
The method of quantification of disinfectant residues using conductivity has been verified in studies by measuring the residues derived from different disinfectant types, at various scales (from bench scale upwards) and various locations, and from laboratory to representative pharmaceutical manufacturing areas. Compared to the current ‘gold standard’ that has long been used for the assessment of residues – an individual’s judgment of ‘visually clean’ - the data from conductivity measurements can eliminate this subjective human appraisal and replace it with scientific assessment.
Comparison of the visual analysis rating versus conductivity data also revealed that the human eye does indeed underestimate the actual levels of disinfectant residues remaining on surfaces in a cleanroom, resulting in potential impacts of risk to safety, contamination, time, and cost.
Summary
Conductivity can be used as a simple and pragmatic tool for residue quantification to aid design and control of cleaning and disinfection regimes in cleanrooms of the pharmaceutical industry.
As per Annex 1 of the EU GMP Guideline [1] and best practice per PDA Journal of Pharmaceutical Science and Technology [2], residues need to be managed, removed or reduced to an acceptable level if a) an impact to the performance of disinfectants subsequently applied is expected, and/or b) cross-reactions of different chemistries, adverse material interactions, or safety risks to the personnel can occur. Residues may also present a source of physical contamination within the cleanroom environment, potentially leading to the release of non-viable airborne particulates that can cross-contaminate pharmaceutical finished goods.
The quantification of residues can be determined by removing the residues from the surface using a wetted wipe or swab, transfer of the wipe or swab into an aqueous solution, and subsequent conductivity measurement of that aqueous solution. Calibration to the water and wipe material used is essential to establish a baseline.
Collection of data by conductivity allows a more appropriate quantification compared with the current standard of visual assessment, which is subjective and dependent on human perception, light, and reflection. Furthermore, it allows monitoring of the residue build-up over time with successive applications of the applied disinfectants or detergents. The effectiveness of any residue removal process via rinsing can also be assessed which allows end users of disinfectants to implement one or multiple rinsing steps at the ideal frequency.
In general, a low conductivity value correlates to a low level of ionizable residues left on a cleanroom surface, and achieving this state reduces the risk to user safety and product quality. High residue disinfectant products in turn, can be tracked regarding their level of build-up with the option to implement more frequent rinsing steps to lower the risks from these residues.
1. Introduction
More focus is being given to residues that can be left behind from the cleaning and disinfection regimes that form part of the Contamination Control Strategies “CCS” in pharmaceutical industries. This increased focus has been driven by industry guidelines, best practice recommendations, and inspections by authorities or notified bodies, and more recently by updates in regulations [1,2].
‘Residues’ on cleanroom surfaces can refer to the presence of dirt, dust or soil or remains of excipients or finished products. However, often overlooked are the sometimes quite significant levels of residue derived from the use of detergents or disinfectants, where the amount of non-volatile, ionic ingredients in the product formulation is usually the main contributor. These ingredients will remain on the respective surface after spraying, wiping, or mopping, especially if detergents or disinfectants are applied over multiple applications without a rinsing step. This attribute of residues accumulating, or agglomerating is particularly important for disinfectant manufacturers who make claims of ‘low residue’ or ‘no residue’ products.
The visibility of residues to the naked eye is often linked to the agglomeration phenomenon over time and is in turn heavily dependent on the method of application. For example, if disinfectants are applied by spraying or wiping, or are applied by mopping.
For the most common application techniques for disinfectants - wiping or mopping- an increasing level of residues also correlates to the choice of mop or wipe materials and the ability of that material to reabsorb residual disinfectant either physically (such as through mechanical action) or chemically (for example, ionic interaction) during the application process. Hence, the structure, the material of construction, and the fabric of the wipe or mop substrates also plays a key role in cleanroom residue management.
Various methods and techniques are available for the quantification of residues, from qualitative analytical methods like Liquid or Gas-chromatography, or Titration through to quantitative methods such as UV, IR, or Conductivity.
The benefit of being able to use a quantitative method that can give you a rapid result using a portable device is that it enables end users of detergents and disinfectants to have an immediate read-out in the environment being evaluated. In particular, the method of conductivity is a practical tool to assess and quantify residues in real-time. Sample collection by water-wetted wipes and read-out of results is complete in minutes, which allows objective measurement of the level of residues and data analysis in-situ, to improve rinsing frequency and techniques and select the most appropriate rinsing agents.
The higher the conductivity measurement, the higher the amount of ionic or charged (polar) molecules on the surface. In practice, the target surfaces need to be wiped or swabbed with a material of low polarity and high purity to allow the highest recovery rate of the residues (e.g., wipes or swabs made of 100% Polyester). Many common substrates like Polyester/Cellulose bind residues and do not release them back into the aqueous solution, resulting in a falsely lower conductivity reading.
2. Material and Methods:
2.1 Disinfectant products being evaluated:
The evaluation of conductivity as a suitable and sensitive method was done by measurement of seven different disinfectants made of Quaternary ammonium Compounds (often referred to as Quats).
Quats are selected as they are among the most used disinfectants for daily contamination control in cleanrooms. The study focused on the analysis of products made of Didecyldimethylammonium chloride (DDAC) with various amounts of active, and additives including Benzalkonium Chloride (BAC) and boosters. (A booster is a substance that accelerates efficacy via a synergistic effect with the active substance of the disinfectant).
Table 1: Summary of seven DDAC-based Disinfectants being tested over multiple applications

All products have been diluted (if required) and applied as per the respective Instructions of use.
2.2 Conductivity meter and Instruction of Use:
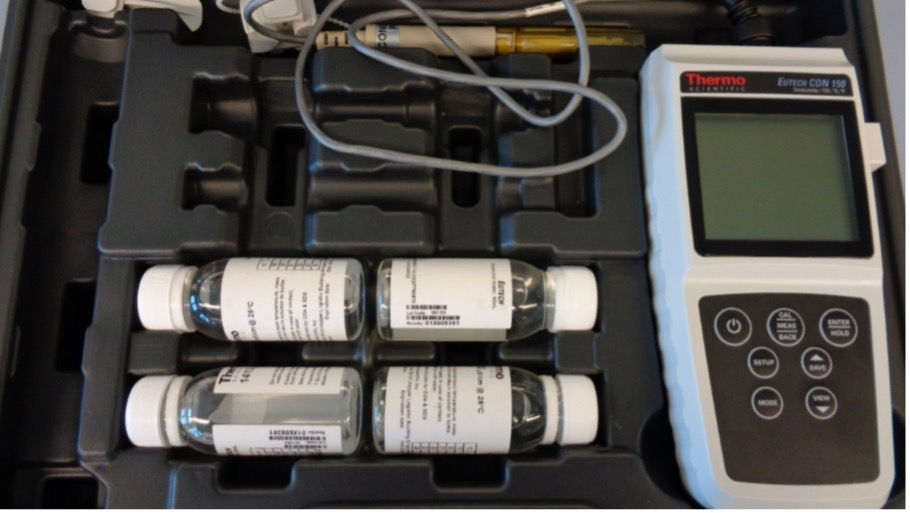
To measure conductivity, a standard portable handheld device is most suitable, see picture 1.

Picture 1: Example of a portable Conductivity meter being used.
For the sampling method from the cleanroom surface, a wipe/swab is used to pick-up residues from the surface being analysed, see picture 2.
A dedicated Instruction for Use (IFU) can be found in the Appendix 2

Picture 2: Photo of sample collection via wiping of the surface with a wetted wipe and subsequent measurement of the residues from the wipe in aqueous solution using a Conductivity meter.
Summary of Instructions of Use for conductivity method:
Daily calibration of Conductivity meter recommended (refer to instrument manufacturer’s instructions)
Conductivity value of chosen water and wipe/swab to be determined as an internal benchmark: Wipe/ Swab (ideally made of 100% Polyester) to be placed in selected water (ideally Water for Injection) in a suitable vessel for at least 60 seconds, value measured and noted.
Aqueous soaked wipe removed from vessel, and excess water wrung back into the vessel. Wipe used to sample (wipe off) residue from a defined surface area of the surface being tested.
Surface should be wiped in overlapping strokes to ensure no area is missed.
Wipe is placed back into the vessel containing the selected water and left for at least 60 seconds, the conductivity value measured and noted.
Conductivity value after wiping of the surface (step v.) is compared to the benchmark of the dry wipe in water (step ii).
Selection of high purity water, ideally WFI, and a Wipe with a low particle value, e.g. a 100% Polyester knitted substrate with ultrasonic or sealed borders should result in a very low baseline of less than 10 µS/cm. Baseline values below 10 µS/cm give the most sensitive quantification for analysis of residues derived from disinfectants on a surface.
2.3 Surfaces disinfectants application by mopping:
Application of the various Quat-based disinfectants (see Table 1) was performed in a cleanroom under controlled conditions by mopping.
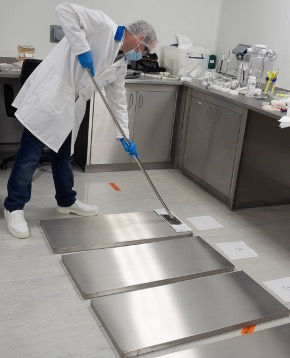
316L Stainless steel panels of 1000mm x 430mm in size were used in order to have a defined, standardized surface (see picture 3).

Picture 3: Stainless steel panels before application of disinfectants.
Application of the disinfectant performed via mopping, using a disposable 100% polyester mophead soaked with 150ml of disinfectant solution (picture 4).

Picture 4: Application of disinfectant via mopping on stainless steel panels.
In total, 5 panels were evaluated. From left to right, panel 1 was mopped once, panel 2 mopped 3 times, panel 3 mopped 5 times, panel 4 mopped 10 times and panel 5 mopped 15 times. In between each mopping step, the disinfection was allowed to fully dry on the respective panel.
The number of up to 15 mopping steps allowed to monitor the accumulation phenomenon of the different disinfectants. The number of applications being applied can be seen on the white sheets above the panels.
The disinfectants were applied to stainless steel panels by mopping using vertical strokes and allowed to dry, simulating the best practice mopping technique for a cleanroom environment (see picture 4) by same operator.
2.4 Assessment of the dried residues after application using visual ranking in a panel test versus conductivity:
A panel of five independent visual assessors ranked the appearance of the dried residues on the test surfaces. The residue appearance was ranked on a scale of 1 to 5 (1= clean, 5= dirty), see appendix 1.
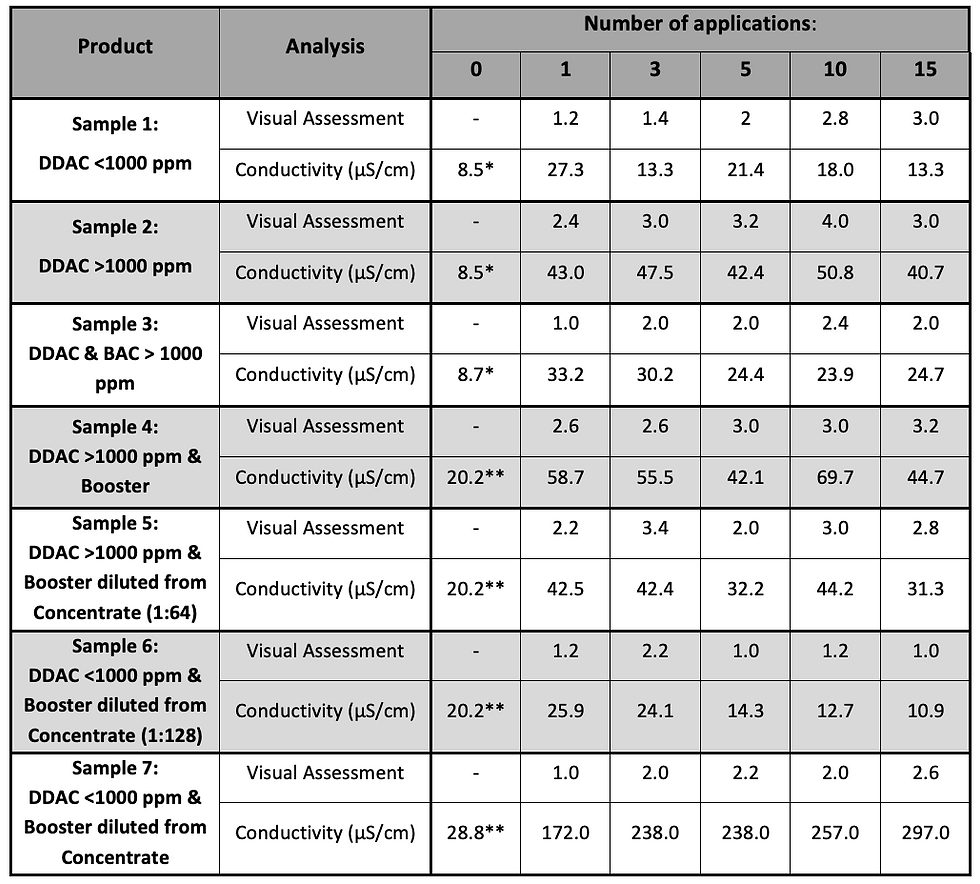
Following the visual assessment, the panels were wiped to remove disinfectant residues for conductivity testing using the method described in section 2.2. The panels were wiped in a single stroke over the length of the dried surface with a water-soaked polyester wipe and then the conductivity was measured (table 2).
3. Results:
The residues remaining on the surface from seven Quat-based disinfectants, applied over multiple applications onto Stainless Steel panels via mopping have been assessed by both visual ranking and conductivity measurement at an independent external Institute.
The visual ranking was assessed by a ‘blind’ panel test using cleanroom trained personnel.
Conductivity was determined via wiping of residues from the surface and measurement of the residues recovered in an aqueous solution, as described in section 2.2.
3.1 Comparison of visual vs. conductivity assessment of seven Quat-based disinfectants for up to 15 applications
After the application of the disinfectants and subsequent drying after each application, the panels have been visually assessed. The rating was done on a scale from 1 to 5, with a score of ‘1’ being a visually residue-free (shiny stainless steel) surface, to ‘5’ being a surface with significant or ‘strong’ visible residues, see scoring legend in appendix 1.
Figure 1 summarizes the results of the seven investigated disinfectants from a single application, up to 15 applications. Figure 1a) gives the visual scoring over 15 applications of the same products while Figure 1b) gives the Conductivity over 15 applications.

Figure 1: a) Visual scoring of up to 15 applications of seven Quat-based products

Figure 1: b) Conductivity measurement of up to 15 applications of seven Quat-based products
Comparison of the two figures shows there is no direct correlation between visual ranking and conductivity measurement. Moreover, the conductivity measurements prove that a higher amount of residue was present on the surface, than the visual scoring ranking indicated.
Individual results of visual assessment and conductivity are given in table 2.
Table 2: Visual Rating and Conductivity results of up to 15 applications seven disinfectants.

* Benchmark of Water and Wipe on Day 1
** Benchmark of Water and Wipe on Day 2
Key findings and interpretations of the analysis as reported in table 2:
After 15 applications, sample 1 and sample 6 gave the lowest conductivity readings (13.3 and 10.9 µS/cm respectively), while sample 3 and sample 6 resulted in lowest visual ranking (2.0 and 1.0 respectively)
Sample 7 resulted in highest conductivity values after the first and last application (172 and 297 µS/cm respectively) however, visual scoring was comparatively low with up to 2.6 rating only
While visual assessment has been lowest after first application (see samples 1, 2, 3, 4, 5, 7) conductivity depicted a contrary trend of steady-state or decreasing values (see samples 1, 3, 5 ,6)
When considering the information provided on the Safety Data Sheet (SDS) on composition and dilution rate (to give the final use solution), the conductivity data are more intuitive and logical results in comparison to the visual assessment.
A typical example of a product being visually ranked as ‘no’ to ‘low’ residue was sample No 7 with visual ratings of 1.0 up to 2.6 on a scale of 1 to 5. However, the Conductivity data clearly demonstrates a steady residue build-up over multiple applications (see figure 2 and table 2).
By contrast, sample number 1 was scored as visually having a high amount of residues, while the Conductivity results actually revealed a steady, low level of residues (see figure 2 and table 2).

Figure 2: Comparison of visual scoring versus Conductivity measurement over 15 applications of two Quat-based disinfectants.
The significant differences between visual scoring versus data derived from conductivity measurements highlight the risk of rating a surface as clean using only human visual assessment. Assigning a status of ‘visually clean’ can present a high risk of underrating the level of residues present, and the associated risk and impact thereof.
This is particularly true for the accumulation or agglomeration of disinfectant residues that result in non-visible oily layers which can then present a risk to safety (greasy, slippery surfaces), or which inhibit or interact with disinfectants - like sporicides in rotational regimes. For example, oxidative and/or chlorinated sporicidal products could exceed toxicological levels or thresholds like worker exposure limits due to the rapid decomposition of these sporicidal agents after application triggered by residues remaining on the surface from Quat-based disinfectants.
3.2 Conductivity as a supporting tool for the definition of cleaning and disinfection regimes.
To support the design of a total cleaning and disinfection regime and/or the rinsing frequency (and their justification in audits), the Conductivity method is an excellent tool. It allows the end user to measure and assess the residue profiles of different disinfectants in a simple manner, on-site, in real-time.
It can be seen in the residue profile data of the seven disinfectants tested (figure 1b) that conductivity measurements for successive applications can reveal if a disinfectant results in a:
i) residue build-up effect
In the example of sample number 7, a high conductivity value was obtained after the first application which then steadily increased over the course of the subsequent applications (see Figure 1b and 2).
ii) a ‘steady-state’ (when equal amounts of residue are applied and removed by the application method, and after how many applications this begins to occur)
For other products like samples 2 and 3, see figure 1, the conductivity values can be seen in a steady state, not increasing or decreasing with the number of applications. For the analysis given in Figure 1, as standard deviation of 10 µS/cm using WFI with a 100% Polyester Wipe was identified.
iii) if the formulation is a true low residue disinfectant.
In the case of very low residue products, the conductivity can decrease over the course of applications, which was observed for sample 1 (see figure 2).
To the best of our knowledge, the data driven analysis of residue management by detection and quantification has not been described by a dedicated method in detail yet. Consequently, the use of Conductivity allows to reveal if a disinfectant in real use results in a residue build-up, steady-state or decrease over time and application.
3.3 Data driven residue management using conductivity measurement within a pharmaceutical site
Irrespective of the residue profile of a detergent or disinfectant, conductivity as a method is suitable to support the design of cleaning and disinfection regimes aligned to the needs of the sites’ contamination control strategy.
During the development of the conductivity methodology for residue determination, data was obtained from a pharmaceutical setting. The plot of conductivity over 20 applications shows the residue profile of two Quat-based broad-spectrum disinfectants used daily at a global pharmaceutical site (Figure 3). The data demonstrates which of the two products results in i) a low residue profile in real application and ii) how efficient the subsequent rinse with water is.

Figure 3: Conductivity results of two Quat-based disinfectants applied 20 times, followed by five successive rinses with water.
One of the two disinfectants being evaluated proved to have a steady-state low residue profile (disinfectant 1), while the other resulted in residue build-up (disinfectant 2). In both cases, the products were applied via mopping of an identical area, using the same frequency and personnel.
In addition to the residue build-up, the rinsing efficiency was monitored and evaluated. In this case, water for injection was used, up to five rinses in total.
In case of the low residue product (disinfectant 1), the water rinse resulted in only a minor reduction of the conductivity, which equals the level of residues on the floor. However, in case of the disinfectant with a high residue result (disinfectant 2), a minimum of four water rinse steps were required to reduce the conductivity to a comparable level to the low residue disinfectant conductivity value.
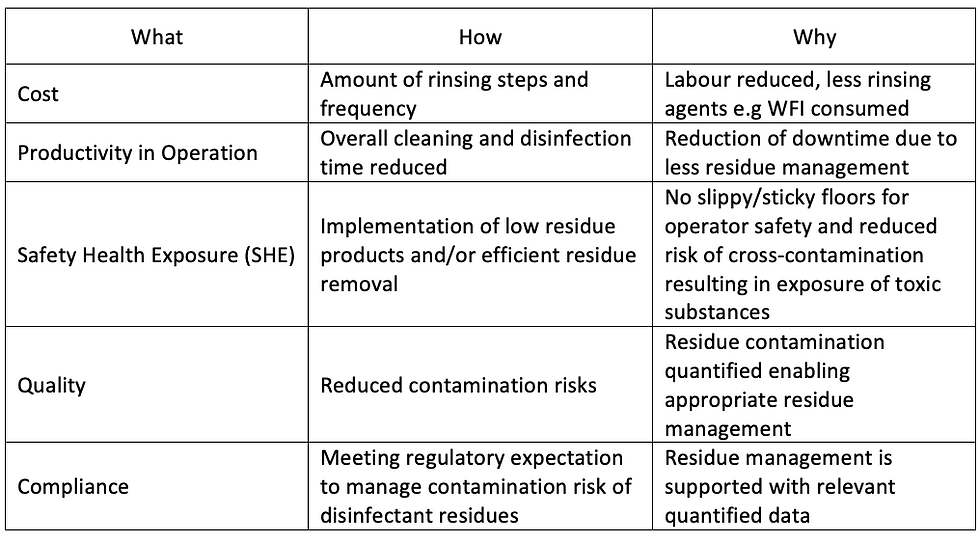
The case above depicts real-time use of conductivity at a global pharmaceutical site for the definition of science-based cleaning and disinfection regimes for their contamination control strategy. The simplicity, of on-site use of the method along with a live read-out was cited as the compelling reason to choose conductivity measurement to define the residue management strategy. The results of the profile and the rinsing efficiency (Figure 3) helped the user to identify the most suitable regimes for their cleanroom design and conditions. It also helped to reduce the amount of rinsing steps, amount of personnel needed, reduced the risk of contamination, and resulted in the reduction of downtime (table 3).
Table 3: Benefits of using conductivity for the definition of cleaning and disinfection regimes

4. Conclusion:
Conductivity can be used as a simple and pragmatic tool for residue quantification for the design of cleaning and disinfection regimes as part of the overall contamination control strategy in cleanrooms. The method enables the detection of the level of residues on the respective surface in real-time and on-site. This in turn allows end-users to monitor the residue build up over time and/or the frequency and efficiency of the removal process via rinsing: the definition of residue management. For disinfectants claiming “low residue”, this method creates data to support users to justify a scientific based cleanroom regime with less rinsing steps and optimised residue management.
The conductivity method has identified that the standard tool of visual assessment (‘visually clean’) may risk underrating the presence of residues, subsequently resulting in either underestimation of safety risks or residue build-up that may occur over repeated applications. The head-to-head comparison of residues being ‘visually’ present on stainless steel panels over multiple applications by the naked eye varied significantly from conductivity data.
Uncontrolled, or unmonitored residue build-up could result in both quality and safety risks. Such as the formation of particles, solids, or precipitants which in turn may pose a risk to product or process quality, safety for operators. Or the risk of interaction with other disinfectants in the regime leading to chemical inactivation of the disinfectant or the release of hazardous materials. In particular, historically accumulated residues that are present due to non-effective rinsing procedures can trigger decomposition of the oxidative sporicidal products.
Given the ability to evaluate residue levels and the effectiveness of residue management in cleanrooms simply and quickly, the conductivity method enables end-users to improve aspects of safety, compliance, quality, and operational cost at their sites. To demonstrate scientific, data-based residue management, conductivity measurement has been used by global pharmaceutical companies for process improvements and in supporting documents to be used for internal and external Audits.
Appendix:
Appendix 1 – Visual Assessment Panel

Appendix 2 - Procedure for Mopping and Conductivity test:

Citation
01. EudraLex The Rules Governing Medicinal Products in the European Union, Volume 4, EU Guidelines to Good Manufacturing Practice Medicinal Products for Human and Veterinary Use, Annex 1 Manufacture of Sterile Medicinal Products, August 2022
02. Derek Willison-Parry et al., Disinfectant Efficacy: Understanding the Expectations and How to Design Effective Studies That Include Leveraging Multi-Site Data to Drive an Efficient Program, PDA Journal of Pharmaceutical Science and Technology, Vol. 74, No. 2, March--April 2020, 249 -263.
03. EudraLex The Rules Governing Medicinal Products in the European Union, Volume 4, EU Guidelines to Good Manufacturing Practice Medicinal Products for Human and Veterinary Use, Annex 15 Qualification and Validation, March 2015

Comments