- tamsinmarshall4
- Apr 3
- 9 min read
Updated: Apr 4
Opinion Review Article | Open Access | Published 2nd April 2025
Means, Ranges and Replicates: Improving Microbial Plate Counting
Tim Sandle, Ph.D., CBiol, FIScT | EJPPS | 301 (2025) | Click to download pdf
Pharmaceutical Microbiologist & Contamination Control Consultant
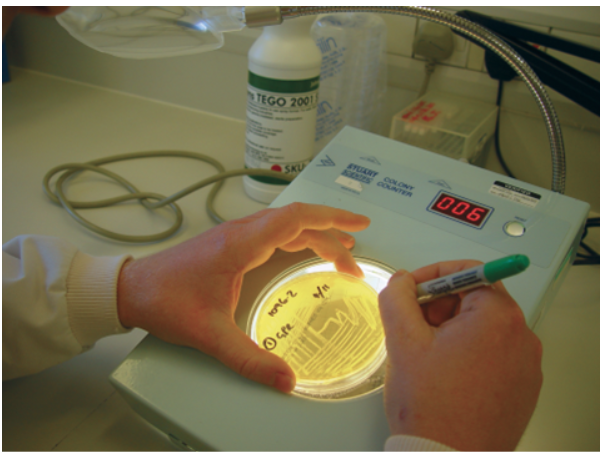
A microbial colony is a visible cluster of microorganisms growing on the surface of or within a solid medium. This may be from a single cell or an amalgam of the same organism of more than one cell or a mix of different organisms. Bioburden levels are commonly measured when conventional methods are deployed in terms of colony-forming units (CFUs). These units provide an estimation of the number of viable bacteria or fungal cells found on a sample, expressed against a unit of measurement, such as per millilitre or per milligram.
When counting CFUs on solid microbiological culture media (agar) there are some aspects of ‘counting’ that need to be considered. These are:
a) Rounding and averaging
b) Significant figures
c) Countable range
d) Statistical error from low counts
This article looks at each of these aspects of the microbial plate count.
Rounding and averaging
To improve the accuracy of the estimation, bioburden tests are performed as replicates. To produce a representative estimate from the replicates, typically an arithmetic mean or a geometric mean is taken for plate count data. This will depend upon the expected distribution of the data and the choice should relate to the method or validation protocol. Where low counts and strong Poisson distribution is expected, the use of the geometric mean is a more accurate approach¹.
Means
The arithmetic mean is where several quantities are added together to produce a total. The arithmetic mean answers the question, "if all the quantities had the same value, what would that value have to be to achieve the same total?"
Whereas, in the same way, the geometric mean is relevant any time several quantities multiply together to produce a result. The geometric mean answers the question, "if all the quantities had the same value, what would that value have to be in order to achieve the same product?". Thus, geometric means are often useful summaries for highly skewed data.
The number of colony forming units (CFU) on a membrane filter or agar plate follows a Poisson distribution so that the variance of the mean value equals the mean value of the count. Therefore, as the number of CFU decreases below 5 CFU/mL, the error of the estimate significantly increases and the accuracy and reproducibility of the method for microbial recovery significantly decreases.

Setting limits
Adopting a limit of 10 CFU/mL tends to represent the lower threshold for the method because the error as a percentage of the mean significantly decreases to 32. At 1 CFU/mL, 2 CFU/mL, or 4 CFU/mL, the error as a percentage of the mean is 100, 71 and 50, respectively.
Significant figures
For raw data colony counts it is common in microbiology for the CFU to determine the significant figure and where the mean is taken, that one decimal to the right of the number is retained².
In reporting, the common approach is to report using two significant figures and thus rounding is required³ This is partly because, when evaluating the significance of a microbiological result, x.y of a colony is nonsensical. This approach also makes greater sense of whole numbers⁴, for example, 12,700 CFU might be better expressed as 13,000 CFU.
Countable range
There are several reviews which describe the countable limit of colonies on an agar plate (where a 90mm plate is taken as standard)⁵. The consensus of the literature is a countable range of either⁶:
30 to 300, or
25 – 250
Such counting ranges typically apply to agar plates of a 9 cm size or larger. For membrane filter plates (typically 55 mm), studies tend to set the range at between 20 to 80 CFU⁷. There are variables which can affect this generalisation, including the size of the colonies (and other aspects of cytometry) and the material that is evaluated. The key ‘unknown’ factor is the tendency for neighbouring colonies to merge or that neighbour colonies may inhibit or conversely stimulate growth.
The upper limit of the countable range being dependent upon:
a. Colony size.
b. Colony behaviour, including the effect of swarming or spreading.
c. Surface area of the agar plate.
d. The general effects of confluence or overcrowding where large numbers of colonies are concerned. e. Statistical error.
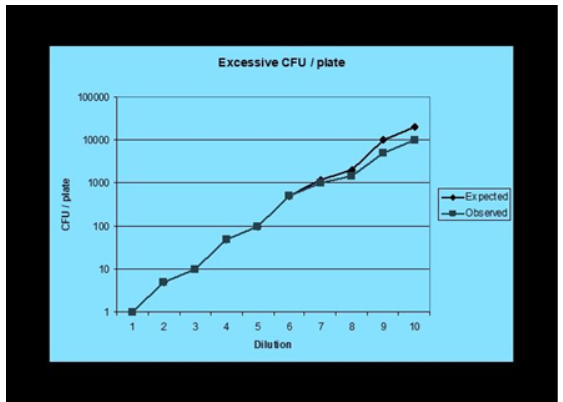
In terms of relating to the upper limit, this is based on a pair-wise comparison of counts from a dilution series, based on the assumption that at the ‘upper limit’ the observed numbers of CFU will fall off the expected numbers at some point and the divergence becomes so significant as to render the observed count as too inaccurate to be of scientific value. To illustrate:
For the lower limit of the countable range, there is a distinction between the Limit of Quantification and the Limit of Detection. In general, with plate counting the assumed Limit of Detection is 1 CFU, since the microbiological culture medium, having passed a test for growth promotion, will have been assumed to be able to support the growth of micro-organisms on any part of the agar surface. Thus, the Limit of Detection is the lowest number of microorganisms that can be detected. If for example, a sample is diluted 1 in 10 then the lowest number of microorganisms which can be detected becomes <10 (or 10 if one colony is recovered). However, with the Limit of Quantification, this is the number of microorganisms that can be reliably recovered (or quantified) using this method. For example, the plate count method has a wide margin of error when low numbers of microorganisms are detected, a phenomenon marginally improved through replicate plate counting. The reliable counting range for a 9cm agar plate, as described earlier, is 25 – 250 CFU⁵

Therefore, for a pour plate, the Limit of Detection is 1 CFU but the Limit of Quantification is 25 CFU.
f. Error arises with the lower limit because the CFU’s follow the Poisson distribution where the error of the estimate is the square root of the mean.
The countable range has implications for dealing with test data:
a. Where a result of zero is recorded, where no colonies are detected either as 0 (for an undiluted sample) or less than the dilution factor (i.e., for a 1:10 dilution this would be <10 CFU / ml and so on).
b. If countable colonies are present, but below the countable range, the colonies should be counted and the result reported as an estimated count. It is recommended that all counts are recorded onto raw data, but the final result reported is ‘less than’ the Limit of Quantification. For example, a 9 cm plate at a 1:100 dilution records counts of 18 and 12. This would be reported at <2,500 rather than <1,500 (mean of the two counts). This is because of the poor accuracy of plate counts below 25.
For counts above the maximum, using an example of a 55mm plate, the result could either be:
a. Reported as “>upper limit” e.g., a sample with more than 200 CFU on a membrane filter at a 1: 10 dilution would be reported as “>2,000 CFU”.
b. If dilutions have been performed, the plates giving a count closest to 80 should be counted. If this is not possible, a portion of the plate should be counted, the number multiplied up for the plate and then by any dilution factor. The result would then be reported as the ‘Estimated Aerobic Count.’ This is the approach favoured where a dilution series extends to 10-4 or further.
c. If the sample can be repeated (that is, it is not a ‘live sample’) and this is clearly shown not to be a retest, then the test should be re-run at a different dilution.
Of the three approaches, ‘b’ is the weakest approach as it is little more than ‘guessing.’ Therefore, counts above the maximal values should be treated as estimates and counts below the minimal values should be considered as subject to gross error.
Statistical error from low counts
Microbiological plate counting is an imprecise technique⁸. The error involved in estimating the number of colony forming units increases as the number of colonies counted decreases, as indicated in the discussion concerning Limit of Detection and Limit of Quantification above. The total error associated with colony counts from the spread, pour and membrane filtration total counts can be expressed as⁹.
% Total error = ± sq. root of A2+B2+C2
Where:
A = % sampling error
B = % distribution error
C = % dilution error
The issue is compounded by the three dissimilar sources of error, which may act singularly or in combination. Examples of each error are:
Examples of sampling error: weighing; mixing
Examples of dilution error: pipetting volumes; diluent volumes.
Typically, dilution error is assumed to be 5.5% ⁹.
Examples of error
The position of microorganisms on the plate or filter and counting errors. The degree of error is dependent upon the number of colonies that have been counted. The error is reduced for higher microbial counts. In addition, transcription errors can occur.
As the distribution of counts complies with Poisson distribution, the errors relating to precision and 95% confidence intervals are, for example, ±9% for a count of 500 CFU (meaning the ‘true value’ falls within a range of 455 to 545); ±20% for a count of 100 CFU (range 80 to 120); and ±60% for the account of 10 CFU (range 4 to 16) ¹⁰. In interpreting the table: the 95% confidence interval is an indication that for the count obtained, there is a 95% chance that the ‘true’ count falls in the indicated range for 19 tests out of 20. For 1 test out of 20 it is possible that the mean count would have fallen outside of the 95% confidence interval, a so-called fault of the first order ⁹.
Greater precision can be produced by increasing the number of replicate plates ¹¹. For example, if we have a count of 100 CFU, using two plates we have a countable range of 70 to 130; whereas with three plates the countable range reduces to 74 to 126. With five plates the range falls to 79 to 121 and with ten plates to 82 to 118. Hence, the precision is affected by both the size of the count and the number of replicate plates. The higher the count (the limitations of the surface area of the agar plate notwithstanding) the greater the precision, and thereby the smaller the error).
The range in which the population can be expected to occur with 95% confidence is useful, especially when evaluating the results from validation studies whereby a microorganism is challenged into a sample and the recovery noted. In some circumstances, where there has been a low level of inoculum, a re-test may be justified. Ideally, for validation studies, a relatively high challenge will be used so as to overcome error but also low enough to demonstrate that the media will grow a small number of micro-organisms. Such a figure is difficult to judge. The pharmacopoeias require a challenge of less than 100 CFU, which provides the low challenge. Prior to 2005, the Ph. Eur. specified a challenge of 10 – 100 CFU, and other standards often specified a challenge of 30 – 300 CFU. These were intended to overcome the exceptionally large error from low level challenges, and this was a better approach.

Statistical error is minimized when:
i) the average count is higher, there is a relation to the amount of sample assessed. The higher the count obtained and the greater the number of replicates then the higher the probability that the sample mean will be closer to the population mean; and, conversely, the smaller the count obtained and the more variable the sample mean obtained, then the greater likelihood that the sample mean will differ from the population mean. Here, increasing the number of replicates does not increase the probability of the sample mean falling closer to the population mean.
ii) the number of replicate plates used increases.
However, the use of multiple plates is not practicable. The use of more than three plates is:
i) Expensive and costly.
ii) Only reduces the statistical error marginally.
It is proposed that to avoid statistical error in the examination of growth promotion, either as part of validation or media testing, that for validation three plates are used. For routine testing, once the method has been established and validated, the use of two plates is the optimal choice.
References
01. Salvesen, I. and Vadstein, O. (2000): Evaluation of plate count methods for determination of maximum specific growth rate in mixed microbial communities, and its possible application for diversity assessment, Journal of Applied Microbiology, Volume 88 Issue 3 Page 442
02. Niemela, S. (1983): Statistical evaluation of Results from Quantitative Microbiological Examinations. Report No. 1, 2nd ed. Nordic Committee in Food Analysis, Uppsala, Sweden
03. FDA (2001): ‘Aerobic Plate Count’, Bacteriological Analytical Manual, Online version, Chapter 3, at: http://www.cfsan.fda.gov/~ebam/bam-3.html
04. Sutton, S. (2006): ‘How Many?’, Pharmaceutical Microbiology Forum Newsletter, Vol. 12, No.6, pp1-10
05. Breed, R. and Dotterrer, W.D. (1916): ‘The Number of Colonies Allowable on Satisfactory Agar Plates’, Journal of Bacteriology, 1, pp321-331.
06. ASTM (2020): Standard Practice for Determining Microbial Colony Counts from Waters Analyzed by Plating Methods, D5465-16
07. Watson Stanley W. et al., (1977), Vol 33, PP 940-946, Determination of Bacterial Numbers and Biomass in the Marine Environment; Appl. Environmental Microbiology.
08. Jarvis, B. (1989): ‘Statistical aspects of the microbiological examination of foods’, Progress in Industrial Microbiology, 21.
09. Environment Agency: ‘The Microbiology of drinking water,’ 2002, DWI
10. Sandle, T. (2001): ‘Repeatability and Precision - Necessary Factors in Standard Testing?’, PharMIG News, No.5, August 2001
11. Weenk, G. H. (1992): ‘Microbiological Assessment of Culture Media: Comparison and Statistical Evaluation of Methods’, International Journal of Food Microbiology, 17, pp159-181
Author Information
Corresponding Author: Tim Sandle, Head of Microbiology
Bio Products Laboratory ,
UK Operations, England
Email: timsandle@btinternet.com

Comments