Opinion Article | Open Access | Published 20th July 2021
A practical methodology to assess VHP cycle effectiveness during routine qualification
Ian Aled Jones*, Will Edwards, Madeline George-Olapade, Leanne Jones** | Cite this article | Download this PDF Paper
Abstract
A novel investigation was undertaken, alongside a standard requalification cycle to measure the time for 2, 4 and 6 log reduction to be achieved with Vaporised Hydrogen Peroxide (VHP) decontamination through the use of chemical indicators (CIs). This was undertaken to determine the rate of VHP efficacy with the current VHP cycle, allowing a predicted overkill to be calculated through extrapolation.
Through visual monitoring of CI colour change during a VHP cycle the rate of VHP decontamination was determined and extrapolated, which demonstrated that at the product location positions, a significant overkill is achieved.
The log reduction colour change of Bioquell Isolator CIs was timed during the requalification of the VHP bio-decontamination process for a standard pharmaceutical isolator. This data was obtained in addition to the standard methodologies used for requalification purposes, allowing analysis of the rate of kill of biological material within the isolator and estimated overkill.
Key Words: VHP, Isolator, Chemical Indicator, Decontamination
Conflict of Interest Statement
This research was sponsored by Ipsen Biopharm Ltd. The authors declare that the investigation was conducted in the absence of any commercial or financial relationship with Bioquell or other manufacturers of chemical indicators that could be construed as a potential conflict of interest.
**Employees of Ipsen Biopharm Ltd, Wrexham Industrial Estate, 9 Ash Rd N, Wrexham LL13 9UF
*Corresponding Author aled.jones@tevaruncorn.co.uk
Introduction
Vaporised Hydrogen Peroxide (VHP) decontamination is a common process used to decontaminate a variety of materials in the pharmaceutical industry, such as whole clean rooms, pharmaceutical isolators and medical equipment. The term VHP however is not well defined as there is significant variation in the way the process is carried out, depending on application and manufacturer. The main application that will be discussed in this paper is the terminal sterilisation of isolators for pharmaceutical fill finish applications.
Proposed in this paper, is a method for gaining informative data on a VHP decontamination cycle that shows both the rate of kill and an extrapolated overkill estimate for multiple locations throughout a pharmaceutical isolator using chemical indicators (CIs).
This procedure has been developed as a supplementary method alongside the use of biological indicator (BI) D-values for either process requalification or cycle time development. The D-value, the time taken for a single log reduction in BI population, as the basis of a cycle time length has been questioned due to the differing behaviour of BIs depending on conditions such as VHP concentration, temperature and relative humidity ¹. Therefore, as a result of small process drift in the equipment, the effect on overall process kill may not be easily predicted.
Varying definitions are given for the process expectations of VHP decontamination from regulatory bodies, concluding that a total kill of 10⁶ population of BIs, gives sufficient sterility assurance in product contacting positions. The same level of kill not being required in areas of the isolator where product will never come into contact, such as air returns.
When using BIs with a starting population of 10⁶ microorganisms, a successful validation would require no remaining colony forming units (CFUs) to remain viable, however Agalloco ¹ makes an important distinction between this and merely a six-log reduction in population, as the complete kill of a 10⁶ population is a more stringent requirement that requires up to a 9 log process overkill reduction. It is considered best practice to apply multiple biological indicators in the same locations in order to manage unexpected BI positive growth as a result of “rogue” BIs. These are defined by Sandle ² as BIs that are outliers and have an increased resistance to the decontamination process than the majority of the BI lot in use due to ‘clumping’ of spores, confluence, or imperfections in the surface of the carrier material where spores may become lodged.
It is possible to apply a mathematical concept to assess the most likely logarithmic reduction in spores and Sandle ² provides an equation to determine this probability, where one positive is noted from a set of three or where two positives are noted from a set of three states. Extrapolating from this equation and assuming a starting BI population of 2x10⁶, two strips failing out of three would give a log reduction of 6.26, one strip failing out of three would give log reduction of 6.69, and one strip failing out of fifty would give a log reduction of 9. He also states that it is important to recognise when resultant BI positives are due to process lethality failure and not rogue BIs.
The general process of VHP decontamination begins with aqueous Hydrogen Peroxide (H₂O₂) being fed onto a hot plate, where it vaporises and is taken up by a stream of carrier air. This stream then travels along a section of transfer pipework before it reaches the point of use. Following ingress into the isolator, it then disperses across the surface area where decontamination occurs.
The mechanism of decontamination is a result of the highly oxidative nature of H₂O₂. The H₂O₂ forms oxidative hydroxide radicals which then oxidise the biological material, causing cell death. How this process takes place is not fully understood and much discussion remains on the mechanistic mode of lethal action ³.
The main distinction between different VHP decontamination processes seen through consultation of a range of literature on the subject, is between the desired phase of the process to obtain maximum log reduction of biological material, nominally described as the “wet” vs. “dry” process. McEvoy & Rowan, ³ state that the effectiveness is far greater in the dry process (>10% RH), however, this viewpoint has been questioned ⁴ ¹. Although the hydrogen peroxide mixture is introduced to the isolator in the gaseous phase, condensation will inevitably occur due to the conditions of ambient temperature inside the isolator. As H₂O₂ has a significantly lower vapour pressure than water, it will more readily condense than water vapour, hence it will be present in much higher concentrations as a constituent of a liquid mixture relative to a gaseous mixture. Maintaining the relative humidity within a range of 20%-50% ensures that H₂O₂ favours formation of micro-condensation over visible condensation ⁵. When other factors such as air flow rate, carrier air temperature, length and temperature of the distribution pipework and temperature of isolator surfaces are considered, it is highly likely that there will be no single mechanism of VHP decontamination occurring in a typical pharmaceutical isolator, but a range of conditions occurring during the cycle leading to variation in the kill across the surfaces of the isolator.
Materials
This paper describes the use of CIs that display an equivalent to a 2-log, 4-log and 6-log reduction, comparable to a BI population during a VHP run. The CIs were manufactured by Bioquell™ and they provide a visible colour change due to the oxidative response of a specially formulated reactive ink on the CI card to indicate log kill conditions, with the CIs calibrated to Bioquell HPV-BI (6 log₁₀ CFU; Geobacillus stearothermophilus). Each CI batch has a reference BI batch with a given D-value ⁶. Use of CIs gives an immediate insight into how kill rates differ throughout an isolator. This can offer valuable information and aid in designing a suitable cycle by adjusting parameters such as injection rate and length of cycle, with the caveat that the CIs cannot be used in place of any BIs for requalification purposes.
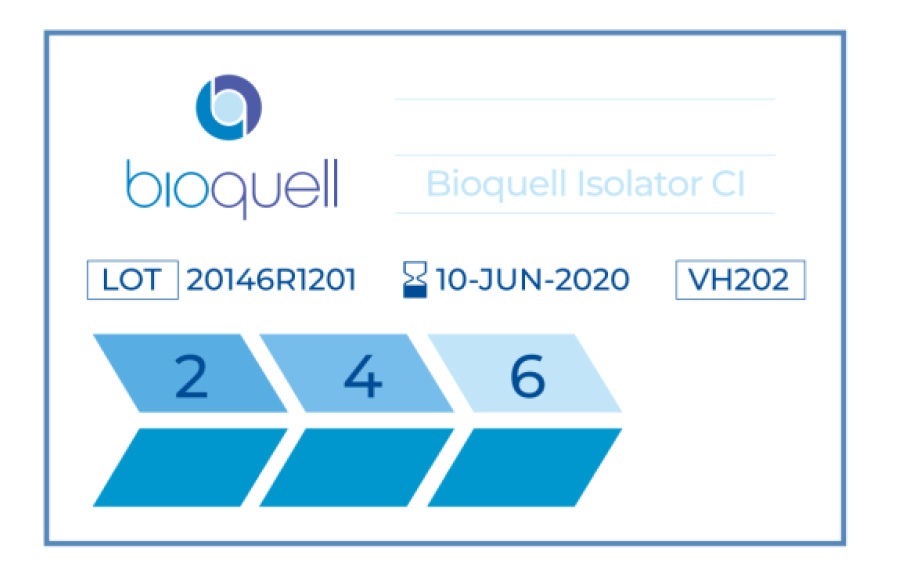
As part of a standard VHP requalification cycle, Bioquell Isolator Rapid Read 6Log₁₀ chemical indicators capable of identifying log 2 to log 6 VHP kill conditions were placed in the isolator and the time undertaken to achieve each log kill condition was measured by visual assessment of the change in colour of the reactive ink on the bottom of the CI matches against the reference strip above. It should be noted that CIs are available from other manufacturers that typically indicate when the 6-log reduction has been achieved during the cycle and a similar methodology could be utilised to measure the time of the colour change.
Figure 1 Example of Bioquell Isolator Rapid Read 6Log₁₀ chemical indicator prior to VHP decontamination
As discussed, this technology offers a valuable tool in verifying the efficacy of VHP decontamination cycles, giving a quantifiable result for the level of biodecontamination achieved and is in alignment with FDA recommendations which suggest the use of CIs as a qualitative tool to show a decontaminating agent has reached a given location.
Use of CIs helps to give an insight into the “worst case” areas during isolator decontamination and how these differ in kill rate to those experiencing the fastest kill. This can offer useful information and aid in designing a suitable cycle by adjusting parameters such as injection rate and length of cycle.
Method
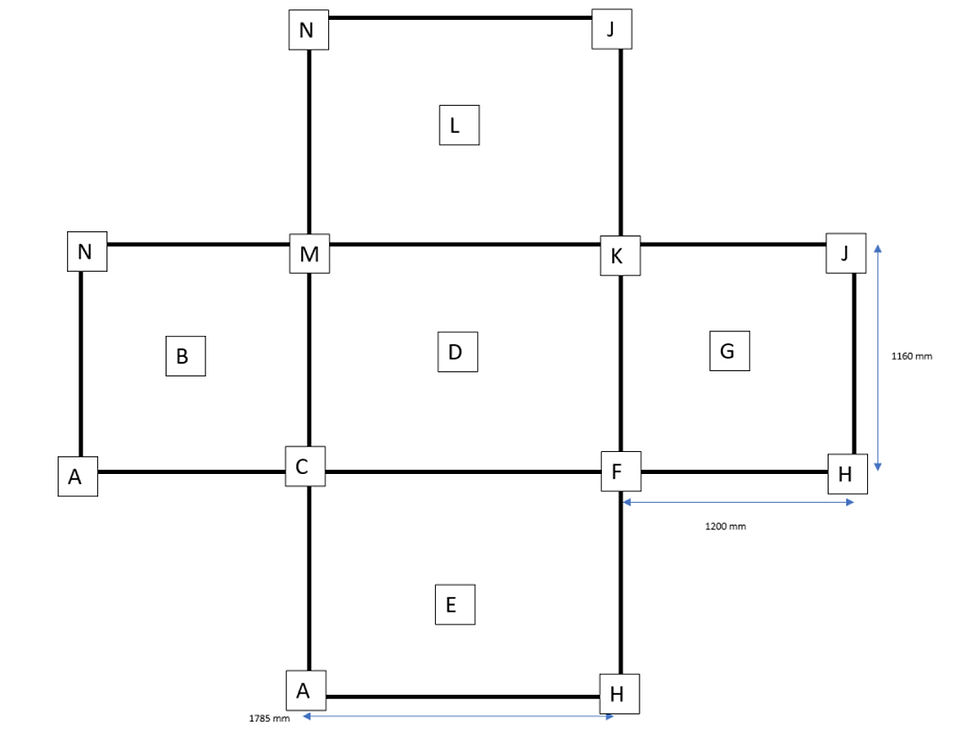
In order to demonstrate the use of this methodology, CIs were placed inside the capper isolator section of a large pharmaceutical isolator at Ipsen Biopharm manufacturing facility and a reduced validation cycle run for the VHP Cycle with a total VHP injection time of 155 minutes was undertaken. A total of 13 CIs were distributed throughout the capper isolator, at each corner of the isolator and at each centre position (Fig. 2). A CI was not placed in the centre of the roof of the isolator. The CI positions are shown as an orthographic drawing with the internal isolator faces unfolded. No reference is made to the equipment inside the isolator, but the size of the isolator is included. 23 locations had BIs (2.2 x 10⁶) placed in triplicate across the capping isolator in geometric, challenging and critical positions.
Figure 2 Orthographic drawing of capping isolator with identified CI Positions
Data Analysis
The CIs were visually observed and the time taken for the indictor colour to match each of the three log reduction guideline shades on the CI (Fig 1) was recorded, a regression plot was produced from this data producing a trendline of the log reduction of the CI versus time for each position in the isolator.
This data may be seen in Fig 3, where the regression lines have been extrapolated to provide a projected cycle time to reach a 12-log kill. All the CI positions gave a strong linear relationship R-sq >90%. From this, the rate of change of log reduction over time (slope) was derived for each position and with use of the total VHP injection time of the validation cycle, an estimate of the predicted log reduction for each position could be calculated. Where the predicted log reduction was greater than twelve, the data is reported as >-12. This data is shown in Table 1.
Figure 3 Regression plot of time taken for log reduction by CI position in the Isolator
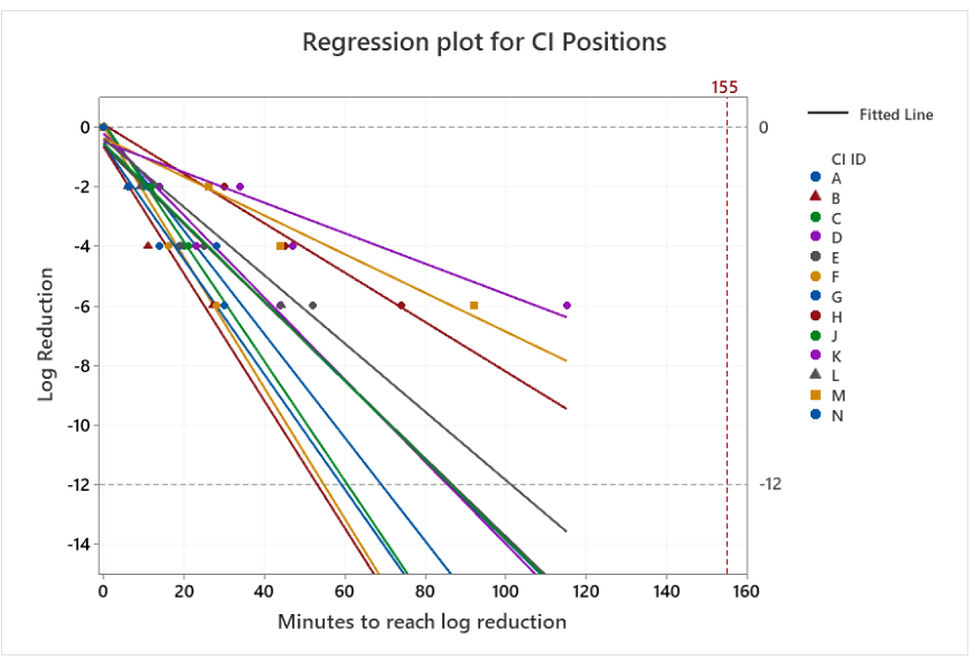
Table 1 Rate of change for CI and calculated log reduction for each position in the isolator
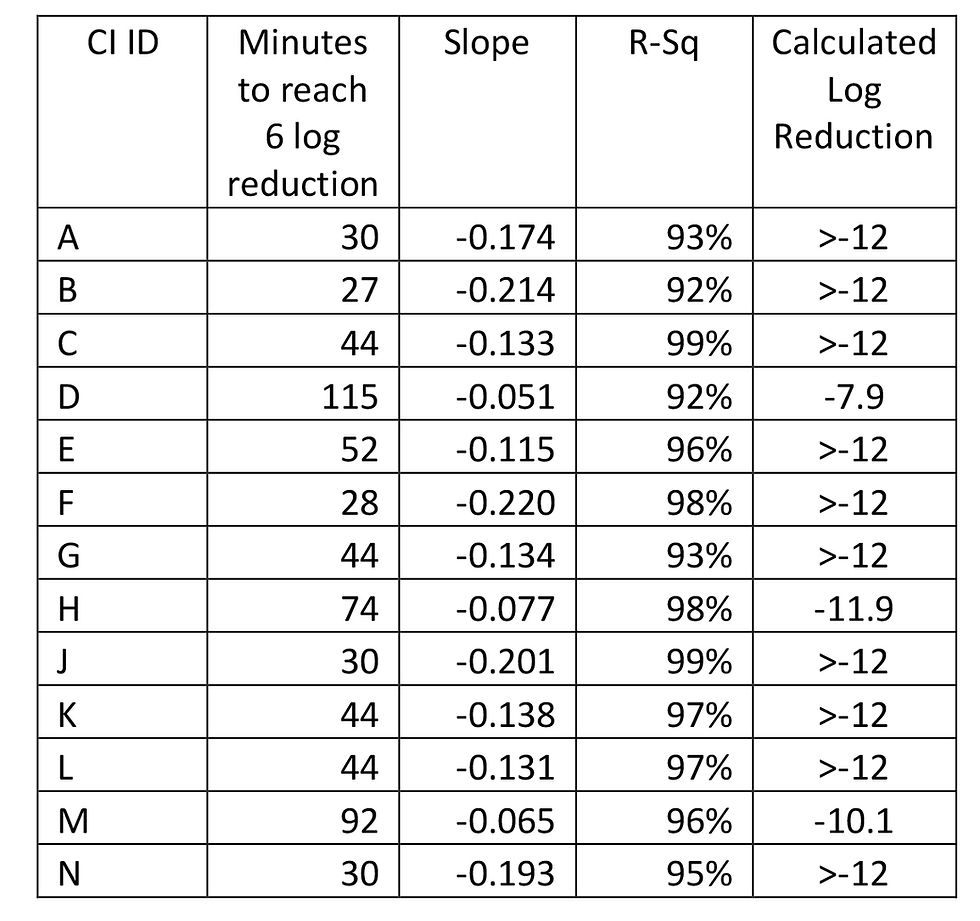
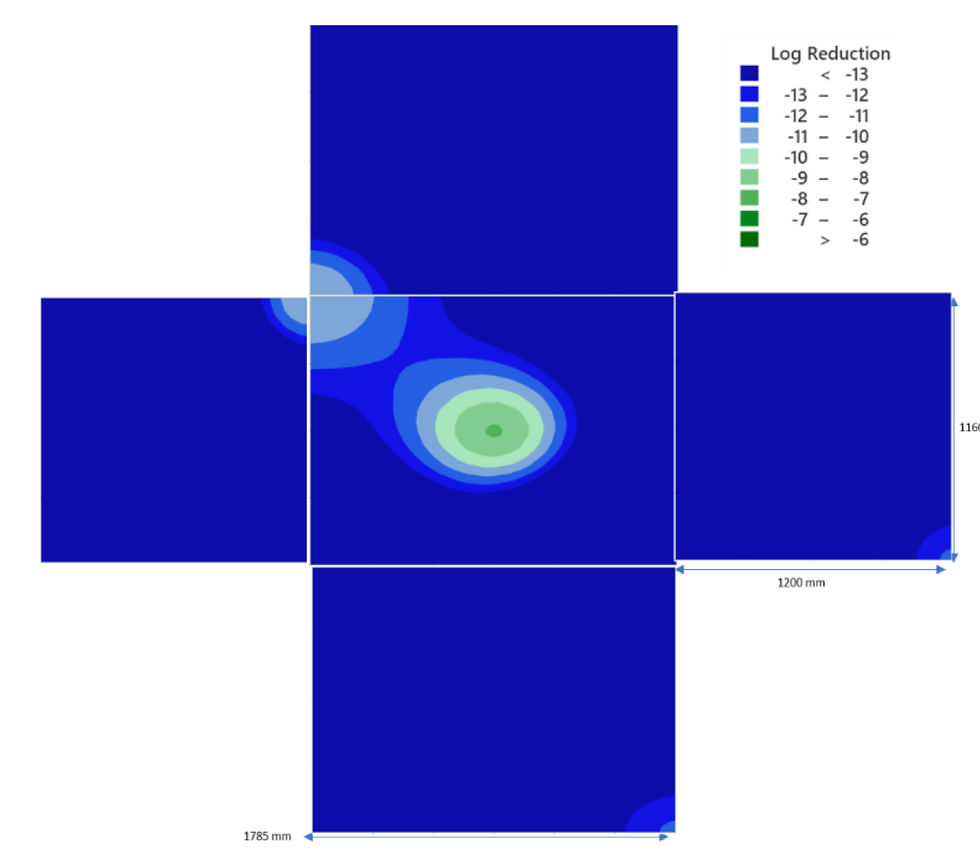
In order to visualise the effectivity of the VHP cycle on the isolator, the data from Table 1 was plotted using Minitab™ software to generate a contour plot. As the CI positions were spaced regularly to form a grid on the X-Y axis, the Z response could be predicted at the x-y intersections of the grid. The data for time to reach 6 log reduction is presented in Fig 4, and the data for log reduction is shown in Fig 5.
Figure 4 Contour plot for time taken for 6 log reduction to be achieved in a capping isolator

Figure 5 Contour plot for Calculated VHP log reduction in a capping isolator
Discussion
Following the use of CIs to aid data gathering from the VHP validation run, significant overkill was seen in the majority of the isolator surfaces, demonstrating adequate cycle performance. Overall, utilising the method of CI recording gave valuable insight into the rate of decontamination of the different surfaces of the isolator, something which is not possible with the binomial results produced by BIs. It was of interest to note, that relatively large differences in log kill could be observed over small distances. It should be noted that the countour maps of log reduction obtained for the surfaces of the isolator do not include the capping equipment and tracks located inside the isolator, hence the pattern seen with longer time being required to achieve a 6 log reduction may be associated with shadow of VHP distribution to the isolator surface.
Conclusion
Biological indicators are required by regulators to present a viable organism challenge equivalent to 6 log bioburden reduction. However, they have significant disadvantages due to their very nature, such as a seven-day incubation period, variability (e.g., “rogue BIs”) and inability to easily map out cycle effectiveness.
The methodology presented using CIs to assess cycle overkill, gives a very cost effective and time efficient approach to development of new VHP cycles or confirmation of VHP effectiveness during routine validation, as this assessment can be undertaken alongside routine validation activities. The mapping of VHP effectiveness using BIs and multiple VHP runs can be very time consuming, this method allows this mapping to be measured in real time. There would also be benefit of this method in its ability to confirm that there was no process drift over time when yearly validation was undertaken and indicate whether the “hard to kill” areas change over time.
For this validation run there was no reported growth from the triplicate BIs in the 23 positions for the validation cycle. This may be expected as the minimum log reduction identified was 7.9, and single strip failures would be likely only if the log reduction was less than 6.7. We propose that this methodology allows a greater understanding of whether resultant BI positives are due to areas of lower process lethality in the isolator or if the BI positives occur in areas of high process lethality, then supporting evidence that the failure may be due to a “rogue” BI.
This methodology may even be applied to monitoring of VHP for routine production cycles, where the CI may be positioned in a high level of the door return in the isolator and a visual assessment of the VHP effectiveness be undertaken for each production cycle.
References
01. Agalloco, J., (2020). Real-World Vapor Phase Hydrogen Peroxide Decontamination. Pharmaceutical Technology, Volume 44, Issue 1.pp. 53-57.
02. Sandle, T., (2020). Rogue Biological Indicators: Are They A Real Phenomenon? Journal of Validation Technology, 26 (1))
03. McEvoy, B. & Rowan, N., (2019). Terminal sterilization of medical devices using vaporized hydrogen peroxide: a review of current methods and emerging opportunities. Journal of Applied Microbiology, pp. 1403-1420
04. Coles, T., (2017). Sanitisation with vapour phase hydrogen peroxide- practical cycle development and future improvements. Clean Air and Containment Review, 29, pp8-12
05. Coles, T., (2016). Understanding the hydrogen peroxide vapour sanitisation process and introducing the MCHP concept, a personal account. Clean Air and Containment Review, 25 pp. 12-14
06. Cols, JM. & Randall, A., (2019). The value of Bioquell Room Chemical Indicator (Room CI) as an instant, quantitative evaluation of efficacy in biodecontamination processes. https://www.bioquell.com/wp-content/uploads/2019/12/UK-White-Paper-Room-CI-LS001-MKT-214-Email.pdf
Author Information
Ian Aled Jones*, Will Edwards, Madeline George-Olapade, Leanne Jones**
Affiliations:
Ipsen Biopharm Ltd, Wrexham Industrial Estate, 9 Ash Rd N, Wrexham LL13 9UF

Comments